

The latest neighbourhood data shows marked differences across Portsmouth. Fifteen of the city’s 125 neighbourhoods sit within England’s lowest 10% on the Index of Multiple Deprivation, while the city’s overall position has improved.
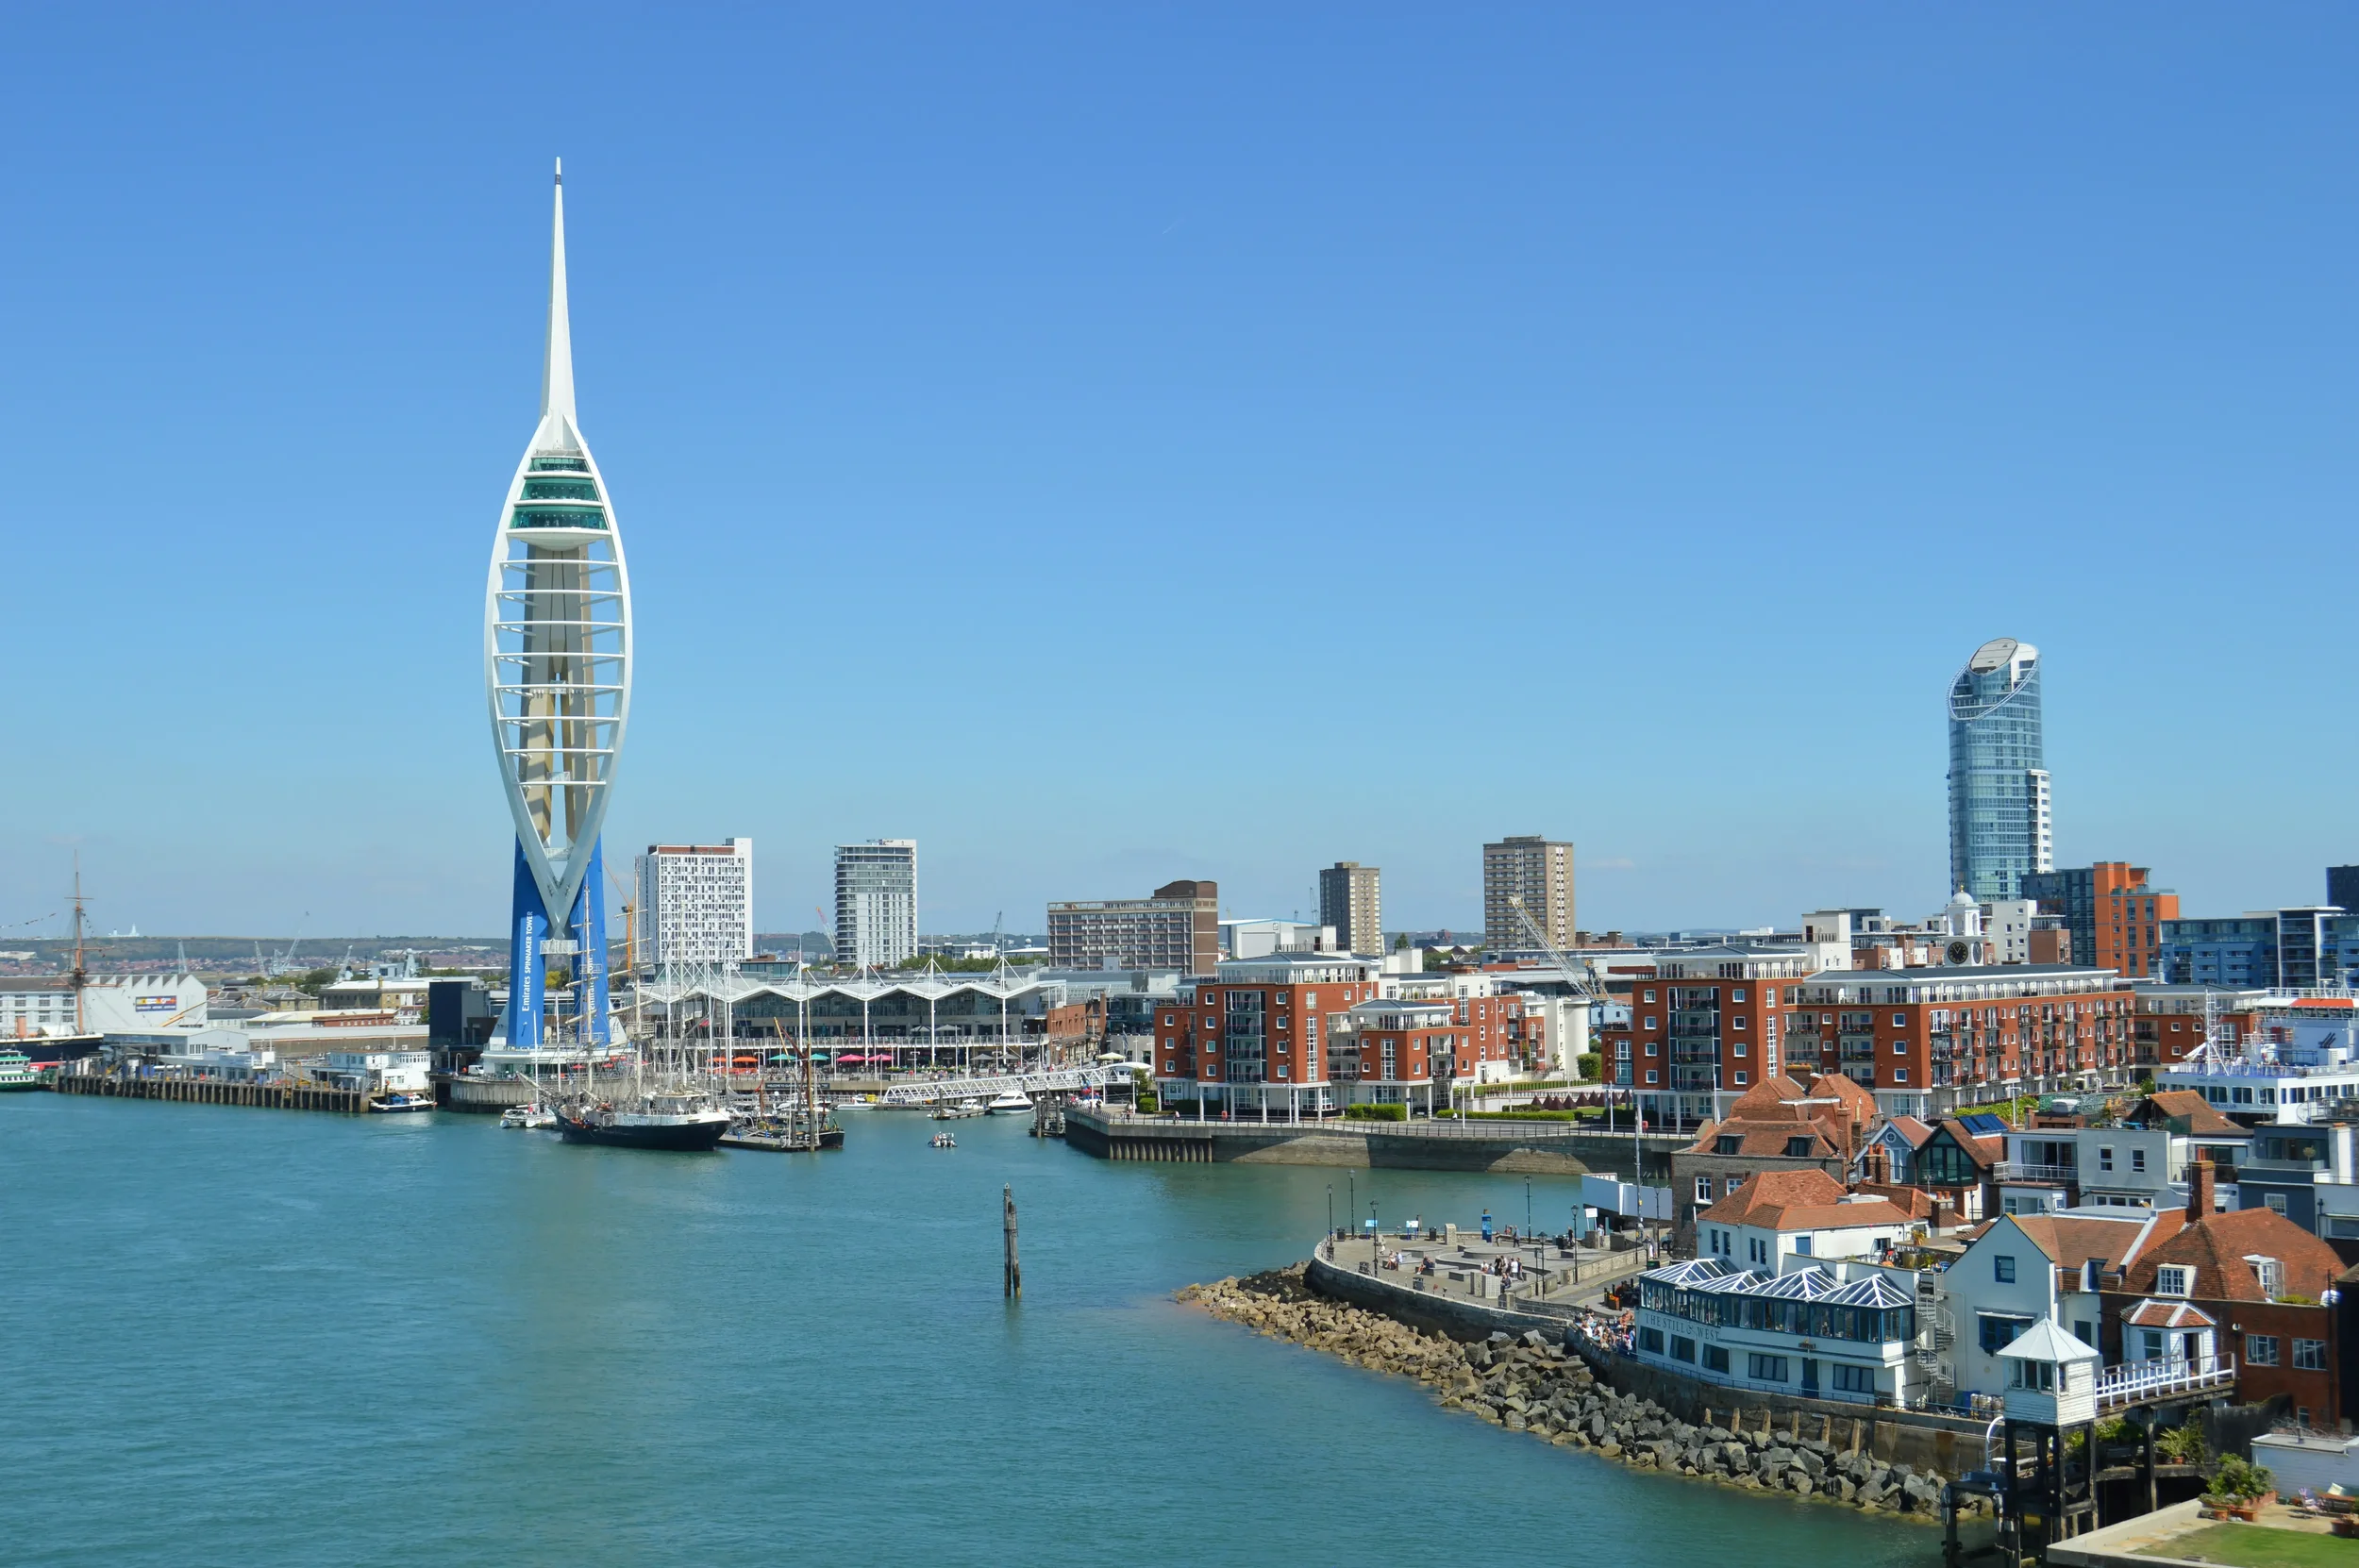
A short journey across Portsmouth can take you between neighbourhoods with very different scores for income, health, housing, education and employment.
The latest Index of Multiple Deprivation figures for Portsmouth show that 15 of the city’s 125 neighbourhoods fall within England’s lowest 10% on the overall index. Eight of those 15 are in Charles Dickens ward.
The figures show two trends at the same time. Portsmouth’s overall national position has improved, while the measure that gives greater weight to its lowest-scoring neighbourhoods has moved in the opposite direction. That suggests progress has not been evenly distributed across the city.
Portsmouth’s overall position has improved, but the pattern is uneven
The official 2025 deprivation figures rank Portsmouth as the 64th most deprived of 296 local authority areas in England, compared with 58th previously after the earlier figures are adjusted to current boundaries. On the face of it, that suggests progress.
A second measure gives greater weight to the lowest-scoring neighbourhoods. On that measure, Portsmouth has moved from 45th to 41st, indicating that the lowest-scoring areas have not improved at the same pace as the city overall.
A city can therefore improve on average while substantial differences remain between neighbourhoods.
Which Portsmouth neighbourhoods rank lowest in the latest data?
The 15 neighbourhoods in England’s lowest 10% are not evenly spread across Portsmouth. They are concentrated in a small number of wards, particularly Charles Dickens.
Nelson contains two of the neighbourhoods, while Fratton and St Thomas each contain one. More than half of the Portsmouth neighbourhoods falling into England’s lowest 10% are therefore located within Charles Dickens ward.
That shows how concentrated the lowest national rankings are within a relatively small part of the city.
What does the Index of Multiple Deprivation measure?
The Index of Multiple Deprivation is broader than income alone. It combines seven areas: income, employment, education, health, crime, barriers to housing and services, and the local living environment.
A low ranking can therefore reflect several factors at the same time, including income, employment, health, education, housing pressures and the quality of the local environment.
What the figures show about children in Portsmouth
A report presented to Portsmouth City Council’s Health and Wellbeing Board in September found that 7,911 children in Portsmouth were recorded as living in relative poverty before housing costs, equivalent to more than one in five children in the city.
In Somers Town, the proportion was reported to be as high as 48%, while the same report found that 37.2% of Portsmouth pupils were known to be eligible for free school meals during the 2025/26 academic year.
The figures provide additional context for understanding differences in household resources, access to activities and the ability to absorb unexpected costs.
Health outcomes also vary significantly across Portsmouth
The differences between neighbourhoods are not confined to income. Portsmouth City Council’s health inequalities work says men living in the city’s poorest areas experience around 15 fewer years in good health than men in the least deprived areas. For women, the gap is around 14 years.
The neighbourhood differences are therefore visible across several measures, including health, housing, education, household finances and healthy life expectancy.
“City-wide averages can hide substantial differences between neighbourhoods. Looking at the local data helps show where household finances, housing, health and the ability to build savings can vary significantly across the same city.”
Gary Moran, Chief Executive, Wessex Community BankHousehold finances vary across the city
Portsmouth’s 2025 resident survey found that 76% of residents were very or quite concerned about the rising cost of living and their ability to manage their finances, while 44% said they were less able, or unable, to meet normal day-to-day living costs.
The results suggest that pressure on household finances is not confined to the neighbourhoods with the lowest national rankings. The effect of higher everyday costs will also differ according to income, housing costs and whether a household has savings.
Why household resilience differs between neighbourhoods
A £500 car repair is the same bill wherever somebody lives, but its impact is not. A household with savings can pay it and move on. A household already spending almost everything it earns on housing, food and energy may have to borrow, miss another bill or simply go without something else.
The ability to build savings can make a significant difference to household resilience, while limited spare income can make unexpected costs harder to absorb.
City averages can hide substantial local differences
Portsmouth is a compact city, which makes the contrast between neighbourhoods particularly striking. The official deprivation areas used in the national rankings typically contain around 1,500 people, so moving only a short distance can mean moving between communities with very different levels of income, employment, health and opportunity.
Looking only at one figure for Portsmouth risks losing that detail. The city can improve overall while individual neighbourhoods continue to record very different outcomes.
What does the latest trend tell us?
The latest figures show that Portsmouth’s overall national position has improved while the measure focused on its lowest-scoring neighbourhoods has moved in the opposite direction. The two trends suggest that improvement has not been uniform across the city.
Some neighbourhoods appear to be moving forward more quickly than others, and the index is designed to capture how several different factors can overlap within the same area.
Income, housing, health, employment and the ability to save can all affect one another, which is why the index considers several measures rather than a single figure.
One city, very different neighbourhoods
The latest figures do not support a simple description of Portsmouth as either improving everywhere or declining everywhere.
Portsmouth has improved overall, but 15 neighbourhoods remain within England’s lowest 10% on the index and more than half of them are located within one ward. The child and health data also show substantial variation across the city.
The differences between Portsmouth neighbourhoods can be measured across income, health, housing, education and healthy life expectancy. In a compact city, those contrasts can exist within only a few miles.